Why Real-Time Data Visualization Is Transforming Embedded Systems Development
After five years developing firmware for aerospace and industrial applications, I've learned that debugging embedded systems often feels like detective work in complete darkness. My journey toward real-time visualization began during FADEC software development for LEAP engines. The SCADE and NPSS simulation environments provided a level of comprehensive system visualization I had never experienced.
Aerospace System Analysis
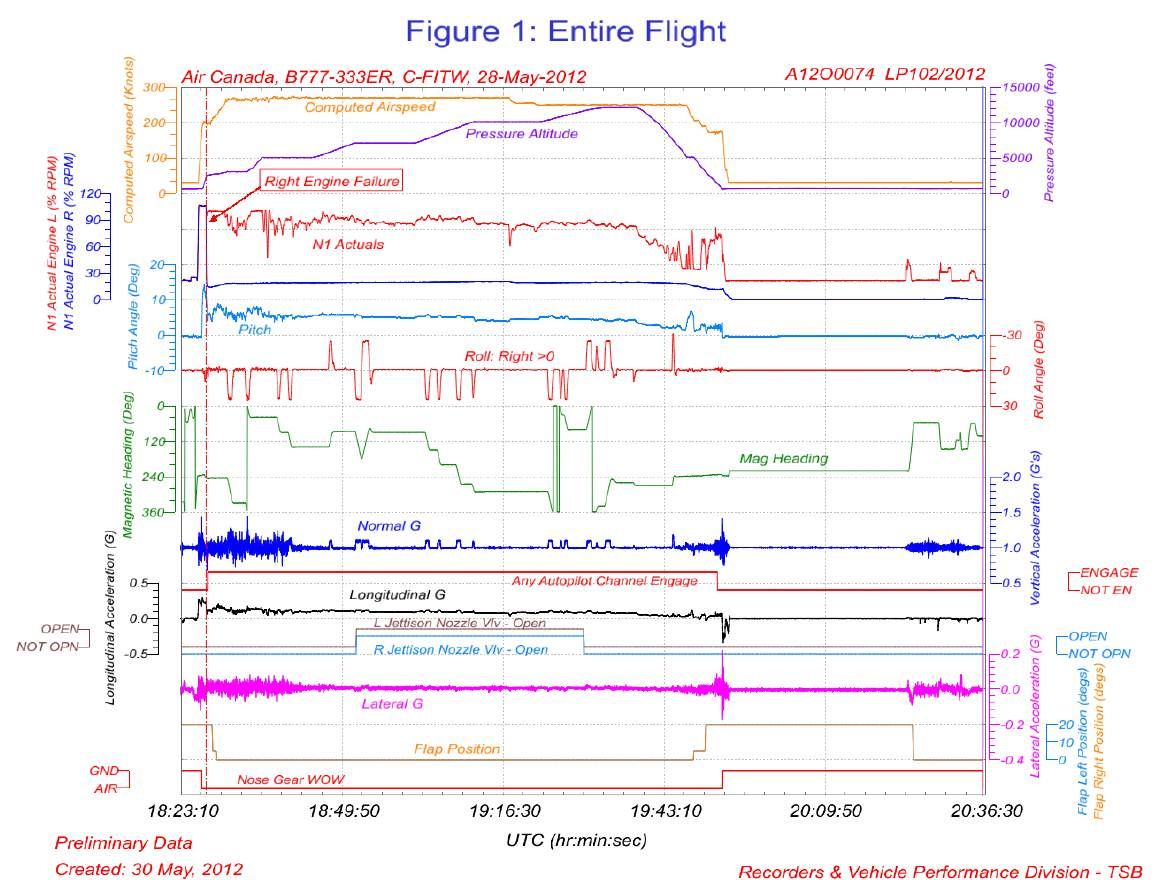
Real-time visualization tools are crucial for analyzing complex aerospace systems, providing immediate insight into flight control systems, avionics, propulsion, and overall system behavior.
SCADE Control Law Modeling
SCADE Suite's Advanced Modeler provides comprehensive system visualization for safety-critical applications, enabling engineers to design and simulate complex control systems with real-time feedback.
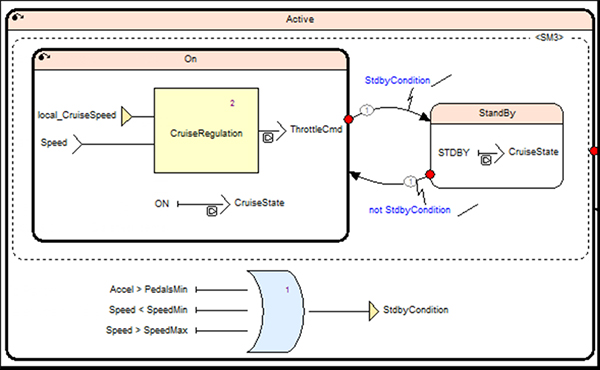
Source: Fluid Codes
This workflow was transformative. I could analyze engine trim balance logic behavior through detailed plots that showed how control algorithms responded to throttle commands and environmental inputs over time. The closed-loop interaction between SCADE-generated software and thermodynamic engine models generated rich datasets that, when visualized, made system behavior transparent and debugging highly intuitive.
When I transitioned to pure embedded software development for microcontroller-based systems, I found myself unconsciously seeking the same comprehensive visibility I had experienced in the FADEC environment. However, the embedded world still relied heavily on traditional debugging approaches that provided fragmented, incomplete system views.
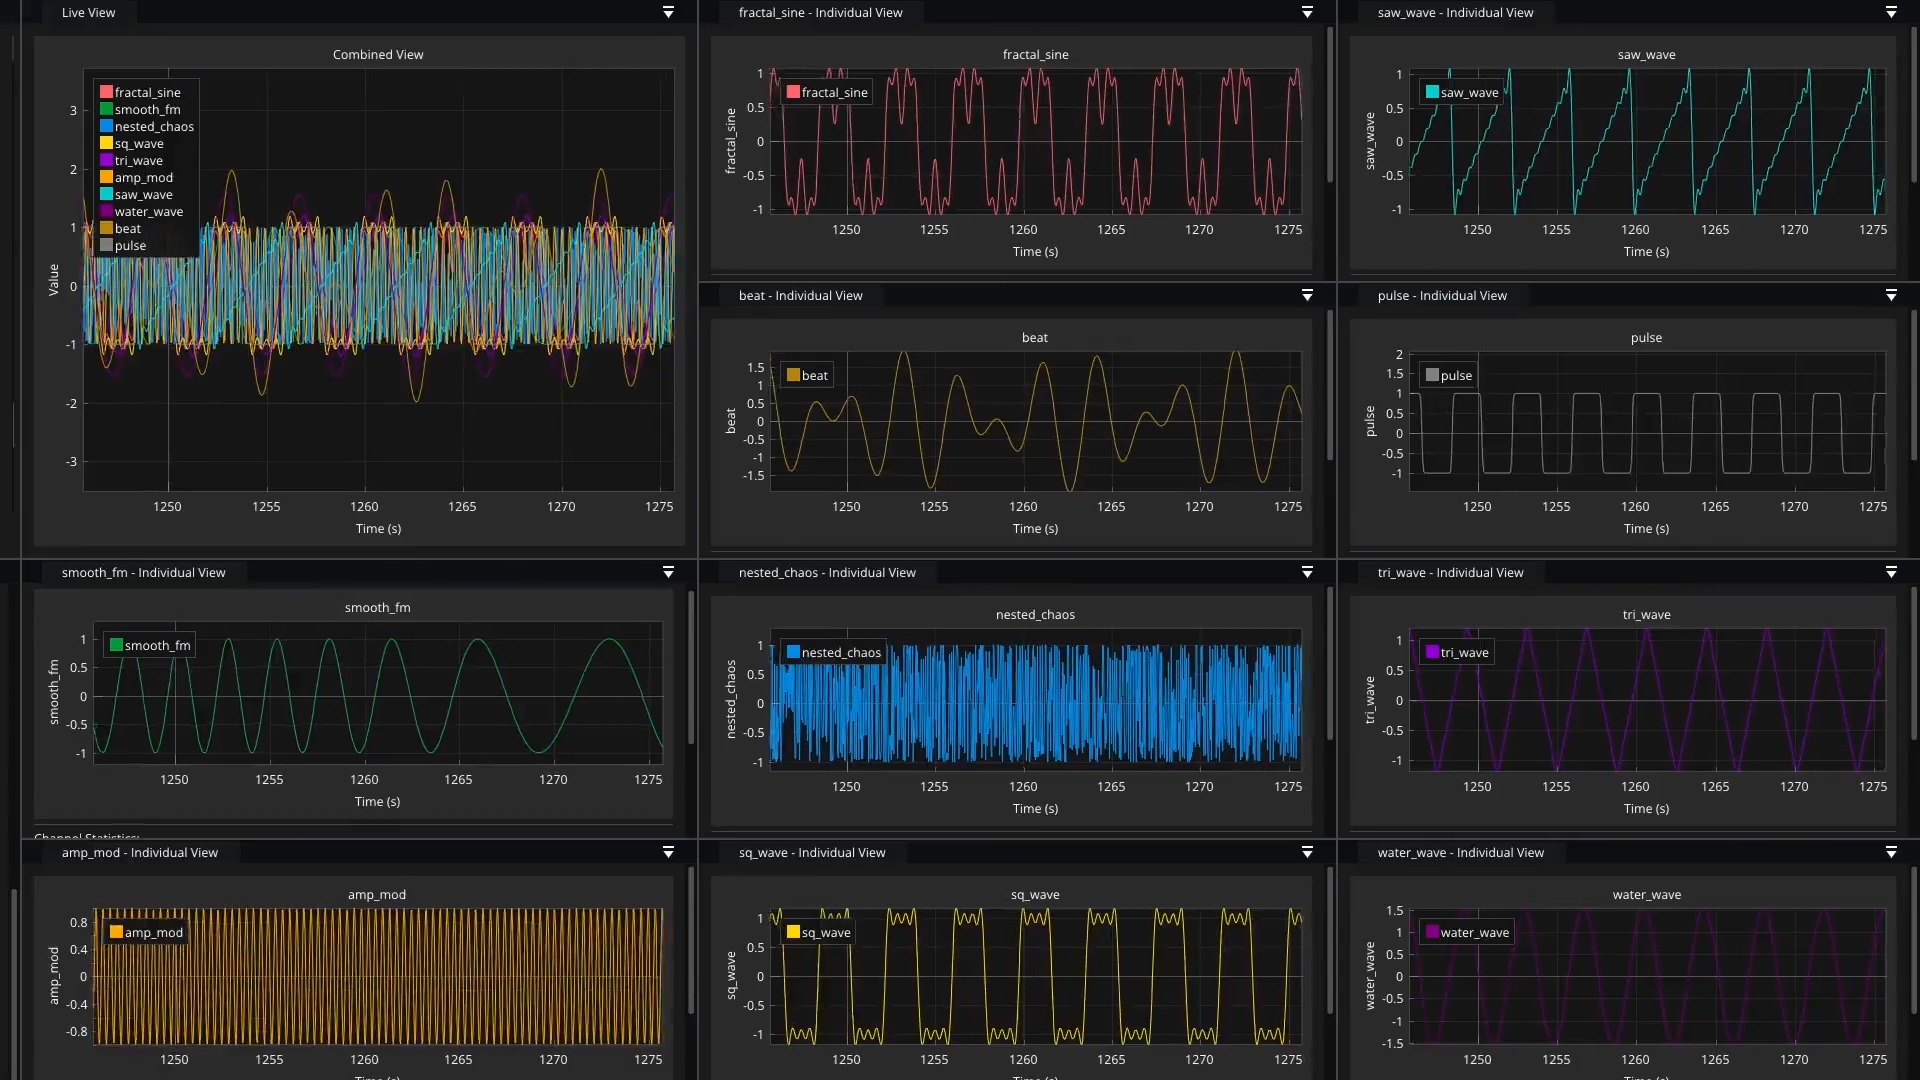
The Result: μscope
This contrast motivated me to explore and develop tools that could bring similar visualization capabilities to embedded systems development. The result was μscope, a professional serial data visualization tool that aims to deliver the same level of comprehensive system insight to embedded development that I experienced in aerospace systems.
The Frustrating Reality of Traditional Debugging
Traditional Debugging
- Fragmented, incomplete views
- Timing overhead and Heisenberg effect
- Slow modify-compile-flash-test cycles
- Limited pattern recognition
Real-Time Visualization
- Continuous, comprehensive insight
- Non-disruptive, real-time monitoring
- Immediate interactive feedback
- Visual pattern recognition
Every embedded engineer knows the pain of traditional debugging methods. Throughout my career, from developing flight computer firmware for aerospace applications to implementing Zephyr RTOS architectures for industrial actuators, I've relied on these familiar but limited approaches:
Serial Print Debugging: This decades-old method is universally accessible via UART but introduces timing overhead that can mask or alter bugs. In time-critical systems, adding printf statements can change interrupt timing, causing intermittent bugs to disappear, a classic debugging paradox.
Hardware Debuggers and Breakpoints: While powerful for inspecting memory, these tools are limited in real-time systems because they halt execution. You can't step through fast interrupt routines or observe live task interactions without fundamentally altering system behavior, which often makes timing-dependent bugs vanish.
Oscilloscopes and Logic Analyzers: These tools are invaluable for capturing electrical signals and protocols on pins, but they only provide an external view of the system. They can't peer inside the microcontroller to show you firmware logic, variable states, or data structure corruption, limiting their use for internal firmware debugging.
The fundamental limitation of these traditional methods is that they provide fragmented, incomplete views of system behavior. You might get sparse textual information about what happened (UART logs), or observe the external electrical consequences (oscilloscope traces), but you cannot see the complete picture of how your firmware responds to inputs and processes data in real time.
The Real-Time Visualization Revolution
Modern real-time data visualization fundamentally changes embedded systems debugging by streaming internal firmware state to external displays without disrupting system timing. These tools give you continuous, live insight into variables and algorithm behavior as your system runs, eliminating the tedious workflow of collecting and post-processing data. This approach is rapidly gaining adoption because it resolves the deep-seated frustrations of traditional embedded development, offering a new way of approaching debugging that accelerates the entire development lifecycle.
While some visualization tools still rely on UART communication and accept the associated overhead, the ability to monitor systems as they evolve over time during testing puts you on an entirely different level when it comes to spotting patterns. Humans excel at visual pattern recognition but struggle with parsing raw text files filled with numbers.
The Six Pillars of Real-Time Visualization
This revolution is built on six fundamental advantages that transform how embedded engineers approach debugging and system analysis.
Beyond technical debugging, these visual interfaces become invaluable for customer communication and field support. When embedded systems fail in the field, being able to show customers clear, visual evidence of what happened through charts and graphs that clearly illustrate the failure sequence is far more effective than attempting to explain complex technical concepts or presenting raw data logs that customers cannot interpret. A simple plot showing sensor values leading up to a failure tells a story that resonates with both technical and non-technical stakeholders, building confidence and trust while facilitating faster resolution.
Acknowledging the Costs and Trade-offs
While real-time visualization offers a powerful paradigm shift, it's essential to acknowledge the costs and trade-offs. The upfront investment in time to integrate a new toolchain is a valid concern, as it's more complex than a simple printf. However, this initial effort is quickly repaid through accelerated debugging and a deeper understanding of your system.
Performance overhead is another consideration, which varies significantly by implementation. While a simple UART-based tool can introduce a measurable load, many dedicated visualization protocols over high-speed interfaces like SWD or JTAG offer minimal performance impact. Finally, memory footprint is a legitimate concern for extremely resource-constrained microcontrollers, but for most modern devices, the flash and RAM required by visualization libraries are a small, manageable cost.
Looking Forward: The Observability Era
The embedded systems industry is transitioning toward more sophisticated development methodologies that emphasize rapid iteration, comprehensive testing, and deep system understanding. Modern companies are recognizing this shift and building entire platforms around advanced embedded system observability.
Sift
Unified observability platform for hardware sensor data, providing comprehensive system insights across distributed embedded systems. Founded by former SpaceX engineers, Sift has raised significant funding to develop telemetry tools that put data back in the hands of hardware engineers.
Source: Payload Space
Memfault
Fleet-wide observability and remote updates platform enabling comprehensive device monitoring and over-the-air debugging capabilities. Memfault provides the same quality data as JTAG debugging but remotely, without requiring physical access to devices deployed anywhere in the world.
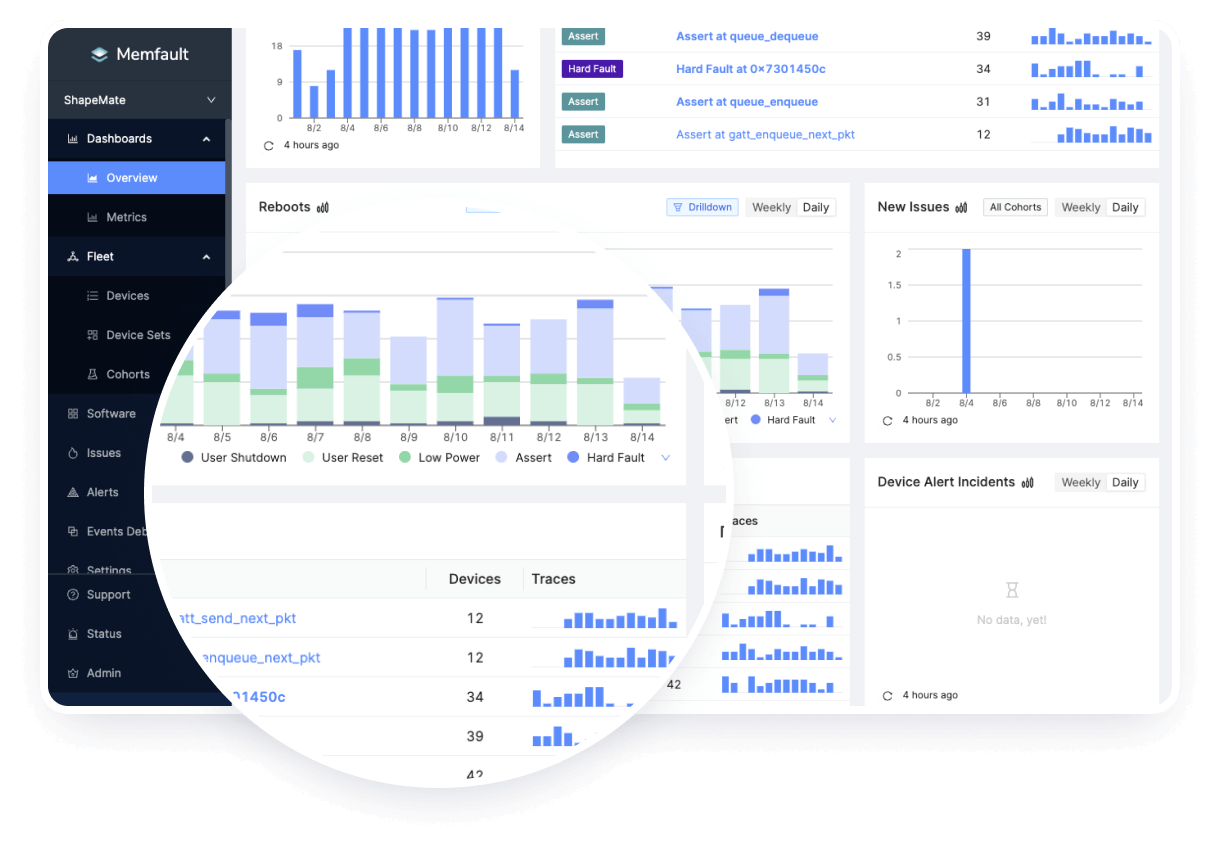
Source: Memfault
Nominal
Unified data stack for mission-critical hardware, providing advanced analytics and insights for aerospace, defense, and industrial applications. Nominal's platform enables comprehensive data management and analysis for the most demanding safety-critical systems.
Source: Nominal
Future development directions point toward even more sophisticated analysis capabilities, including machine learning-enhanced anomaly detection, automated performance optimization, and cloud-based collaborative debugging environments. These advances will further accelerate embedded systems development while improving product quality and operational resilience.
Taking the Next Step
The transition from traditional embedded debugging to comprehensive observability represents more than a tool upgrade, it's a fundamental shift toward more efficient, comprehensive, and enjoyable embedded systems development.
Your Path Forward
Individual Engineer
Start small with a simple serial plotter on a side project. This low-risk approach will quickly prove the value of visual feedback.
Engineering Manager
Consider a pilot project with a dedicated visualization platform. Measure ROI on development time and bug resolution.
C-Level Executive
Understand this strategic investment reduces support costs, increases reliability, and accelerates time-to-market.